How to Read a Strategy Log and Spot Overfitting
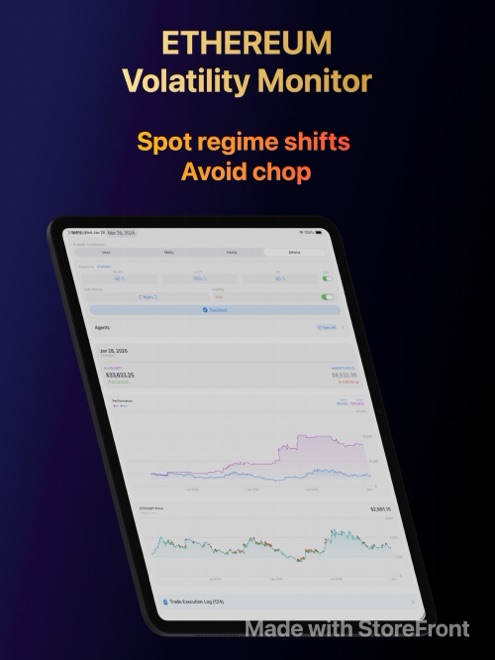
An upward-sloping purple equity curve feels convincing at a glance, yet a single lucky exit before one historic crash can disguise fifty losing whipsaw trades the rest of the year. Market Brief AI stores local forecast cards in Plus and opens the full trade execution log in Pro—recording every simulated BUY and SELL alongside the exact rule that fired it so you can audit backtests line by line.
Why summary return percentages hide fragile strategies
Two simulated strategies can both finish a four-year BTCUSDT backtest ahead of buy-and-hold by 18 percent while behaving completely differently underneath. Strategy A might capture six multi-month bull regimes calmly and sit in WAIT during prolonged bear trends; Strategy B might churn through 190 rapid switches, lose on 70 percent of them, and owe its entire edge to exiting one afternoon before a flash crash.
Reading the trade execution log turns chart admiration into forensic review. Every row documents timestamp, price, action (BUY or SELL), and the exact regime transition, signal trigger, or risk guard responsible.
Four warning signs of overfitting inside an execution log
When you tune lookback windows, confidence thresholds, blend sliders, and guards repeatedly on the same historical span, you inevitably mould rules around past accidents. Scan the execution log for four concrete red flags before trusting any configuration.
Flag any simulation exhibiting these structural weaknesses.
- Single-trade dependency: removing the single best simulated exit causes the entire multi-year curve to underperform buy-and-hold.
- Ping-pong churn: repeated BUY-then-SELL round trips within two or three bars, which real-world fees and spread slippage would quickly erode.
- Rule shadowing: an aggressive hard stop or SuperTrend flip fires 90 percent of exits before the underlying HMM regime probability ever shifts.
- Cliff-edge sensitivity: nudging the HMM window from 90 bars to 100 bars or confidence by 0.05 flips the net backtest outcome from green to deep red.
Combine forecast history cards with out-of-sample checks
Alongside historical backtest logs in Pro, Market Brief AI Plus keeps the last ten timestamped forecast cards per asset—preserving what regime call, confidence percentage, price, and one-line reading the model actually produced at the moment you ran it.
Follow a disciplined four-step audit to separate durable regime persistence from hindsight tuning.
- Split your Binance pair’s available history mentally into an earlier calibration period and a later untouched validation period.
- Choose your model, confidence, and at most one or two signals/guards on the earlier span, then run the exact same settings on the later span without retuning.
- Inspect the Pro execution log across both spans to confirm average holding duration and rule firing mix remain consistent.
- Review saved forecast cards offline over subsequent weeks to see how live closed-bar regime confidence evolves in real time without hindsight.
Keep your research honest and offline-ready
Because Market Brief AI stores synced histories, trained models, forecast cards, and execution logs locally in the device’s own database with zero cloud accounts, you can review past runs offline on a flight and delete any asset cleanly whenever you finish an experiment.
A clean execution log proves only that a statistical rule behaved consistently on historical data—never that future crypto markets will repeat those transitions. Treat every audit as an exercise in critical thinking rather than trading advice.
What is the difference between forecast history (Plus) and the execution log (Pro)?
Forecast history in Plus saves the last ten run snapshots per asset—showing the regime call, confidence, price, and one-line summary at that time. The execution log in Pro lists every individual simulated BUY and SELL across a backtest with the exact rule or guard that triggered it.
Can I read saved forecast cards and execution logs offline?
Yes. Once an asset’s data is synced and a run finishes, the trained model, charts, forecast cards, and execution logs are stored locally on your iPhone or iPad and open without an internet connection.
How many parameters should I tune at once when testing a strategy?
Change one variable at a time—for instance, switching Hera to Hestia while keeping window, confidence, and guards untouched—and test across multiple start dates so you do not overfit to one historical slice.