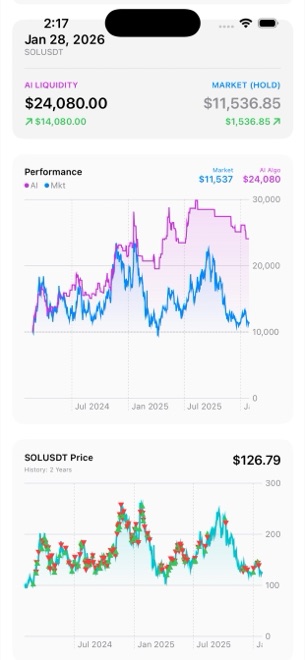
Hidden Markov Models vs RSI & MACD indicators: regime awareness vs oscillator traps
Classic momentum oscillators like RSI (Relative Strength Index) and MACD frequently flash “overbought > 70” early in roaring crypto bull runs and “oversold < 30” halfway through 60% bear cascades. Hidden Markov Models in Market Brief AI solve the missing context problem on iPhone and iPad: classifying whether the underlying Binance USDT series is statistically in a bull, chop, or bear regime first, and testing rules against buy-and-hold—strictly for educational simulation, not financial advice.
1. Why single oscillators misfire without a regime state prior
RSI normalizes recent up-closes vs down-closes over a fixed 14-bar window, implicitly assuming mean reversion around 50. In crypto’s fat-tailed bull regimes, RSI can stay pinned between 70 and 88 while price doubles; selling at the first 72 print leaves virtually the entire trend behind. Conversely, buying RSI 28 during a high-variance bear liquidation cascade catches falling knives.
MACD suffers the mirror problem: as a difference of two EMAs, its zero-line and signal-line crosses whipsaw endlessly inside low-momentum chop. Market Brief AI’s Hidden Markov Models (Hera, Metis, Hestia, and Athena) separate trend, chop, and decline as distinct latent probability distributions before any signal layer fires.
| Characteristic | Hidden Markov Models (Market Brief AI) | RSI (14) & MACD (12, 26, 9) |
|---|---|---|
| Core statistical assumption | Returns switch across latent regimes with distinct drift & volatility | Fixed-window momentum bounded 0–100 (RSI) or dual-EMA spread (MACD) |
| Strong bull trend behaviour | High bull-state probability persists alongside steady positive returns | RSI screams “overbought > 70” early; MACD histogram divergences fake out |
| Bear liquidation cascade | High negative-drift / high-variance bear probability dominates | RSI reads “oversold < 30” repeatedly while price drops another 40% |
| Sideways range / chop | Third chop state absorbs ambiguous low-conviction noise into WAIT | MACD crosses back and forth across signal line continuously |
| Multi-input extensibility | Metis & Athena incorporate CPI, Fed tone, S&P 500 & FinBERT sentiment | Purely univariate price formulas |
2. Layering structural signals & guards atop regimes instead of raw oscillators
Notice how Market Brief AI’s architecture separates two distinct jobs: first, the Hidden Markov Model estimates where the market probably is; second, the optional signal and guard layers decide how simulated posture responds. Instead of raw RSI/MACD guesswork, Pro adds fractal pivots, seasonality, SuperTrend, flags, and five auction-market signals (POC reversion, LVN rejection, balance/imbalance breakouts) plus four crash/drift guards.
Every combination runs through closed-bar backtesting on iPhone and iPad, plotting purple strategy equity directly against blue passive buy-and-hold ($100 to $1B virtual test capital).
| Layer | Free Tier ($0) | Plus ($7.99/mo) & Pro ($12.99/mo) |
|---|---|---|
| Regime probability layer | Hera 3-state HMM | Metis & Hestia (Plus); Athena factorial HMM (Pro) |
| Macro & NLP context | Kronos, Poseidon, Aiolos, calendar agents + Core ML FinBERT | Pro adds Zeus (S&P 500), Demeter (Fed tone) & Kronos surprise/smart exit |
| Tactical signal layer | Seasonality signal | Pro adds SuperTrend, fractal pivots, flags, 5 auction signals & blend slider |
| Protective risk guards | Confidence threshold -> WAIT posture | Pro adds flash-crash, EMA crash, CUSUM drift & hard-stop guards |
| Audit trail | Visual chart trade markers & equity comparison | 10 forecast cards/asset (Plus); full rule-level execution log (Pro) |
3. Testing oscillator habits against regime math on real crypto history
If you grew up checking RSI and MACD on every candle, running a multi-year BTCUSDT or SOLUSDT simulation in Market Brief AI is an eye-opening exercise: watch how bull regime probabilities remain elevated right where naive oscillators flashed premature exit warnings, and watch where regime models also lag during sudden exogenous shocks.
Nothing in the app is time-limited on Free, and every screen reinforces educational discipline rather than financial advice.
| Question | Oscillator answer (RSI/MACD) | Market Brief AI HMM answer |
|---|---|---|
| Is a sharp green run “too high” or a genuine bull regime? | RSI > 70 flags overbought regardless of regime transition math | Evaluates return drift/variance likelihood & regime persistence |
| Should mean-reversion signals fire during a crash? | RSI < 30 triggers dip-buy signals blindly | Bear-regime probabilities + Pro crash/CUSUM guards distinguish cascades |
| Did the rule actually beat passive holding since 2020? | Requires coding an external backtest script | Shown automatically on the purple-vs-blue closed-bar chart |
Why does RSI stay above 70 for weeks during crypto bull markets?
Because RSI compares recent average gains to average losses over a short fixed window; persistent upward drift naturally pins the ratio near the top without implying an imminent reversal.
How does Market Brief AI handle mean reversion vs breakout structure?
Market Brief AI Pro includes five auction-market signals—such as Point of Control (POC) reversion, Low Volume Node (LVN) rejection, and balance/imbalance breakouts—layered atop HMM regime states.
Can I test short 5-minute and hourly timeframes as well as daily bars?
Yes. Market Brief AI syncs daily Binance USDT bars back to 2017 plus recent hourly and five-minute bars.
Are Market Brief AI’s regime and auction signals trading recommendations?
No. Market Brief AI is strictly an educational simulation and research tool; nothing shown is financial advice.